In today’s visual age, infographics reign.
An infographic is a visual representation of data, processes or locations. And while we like to think of them as new, they’ve been around for a long time – think about early cave drawings.
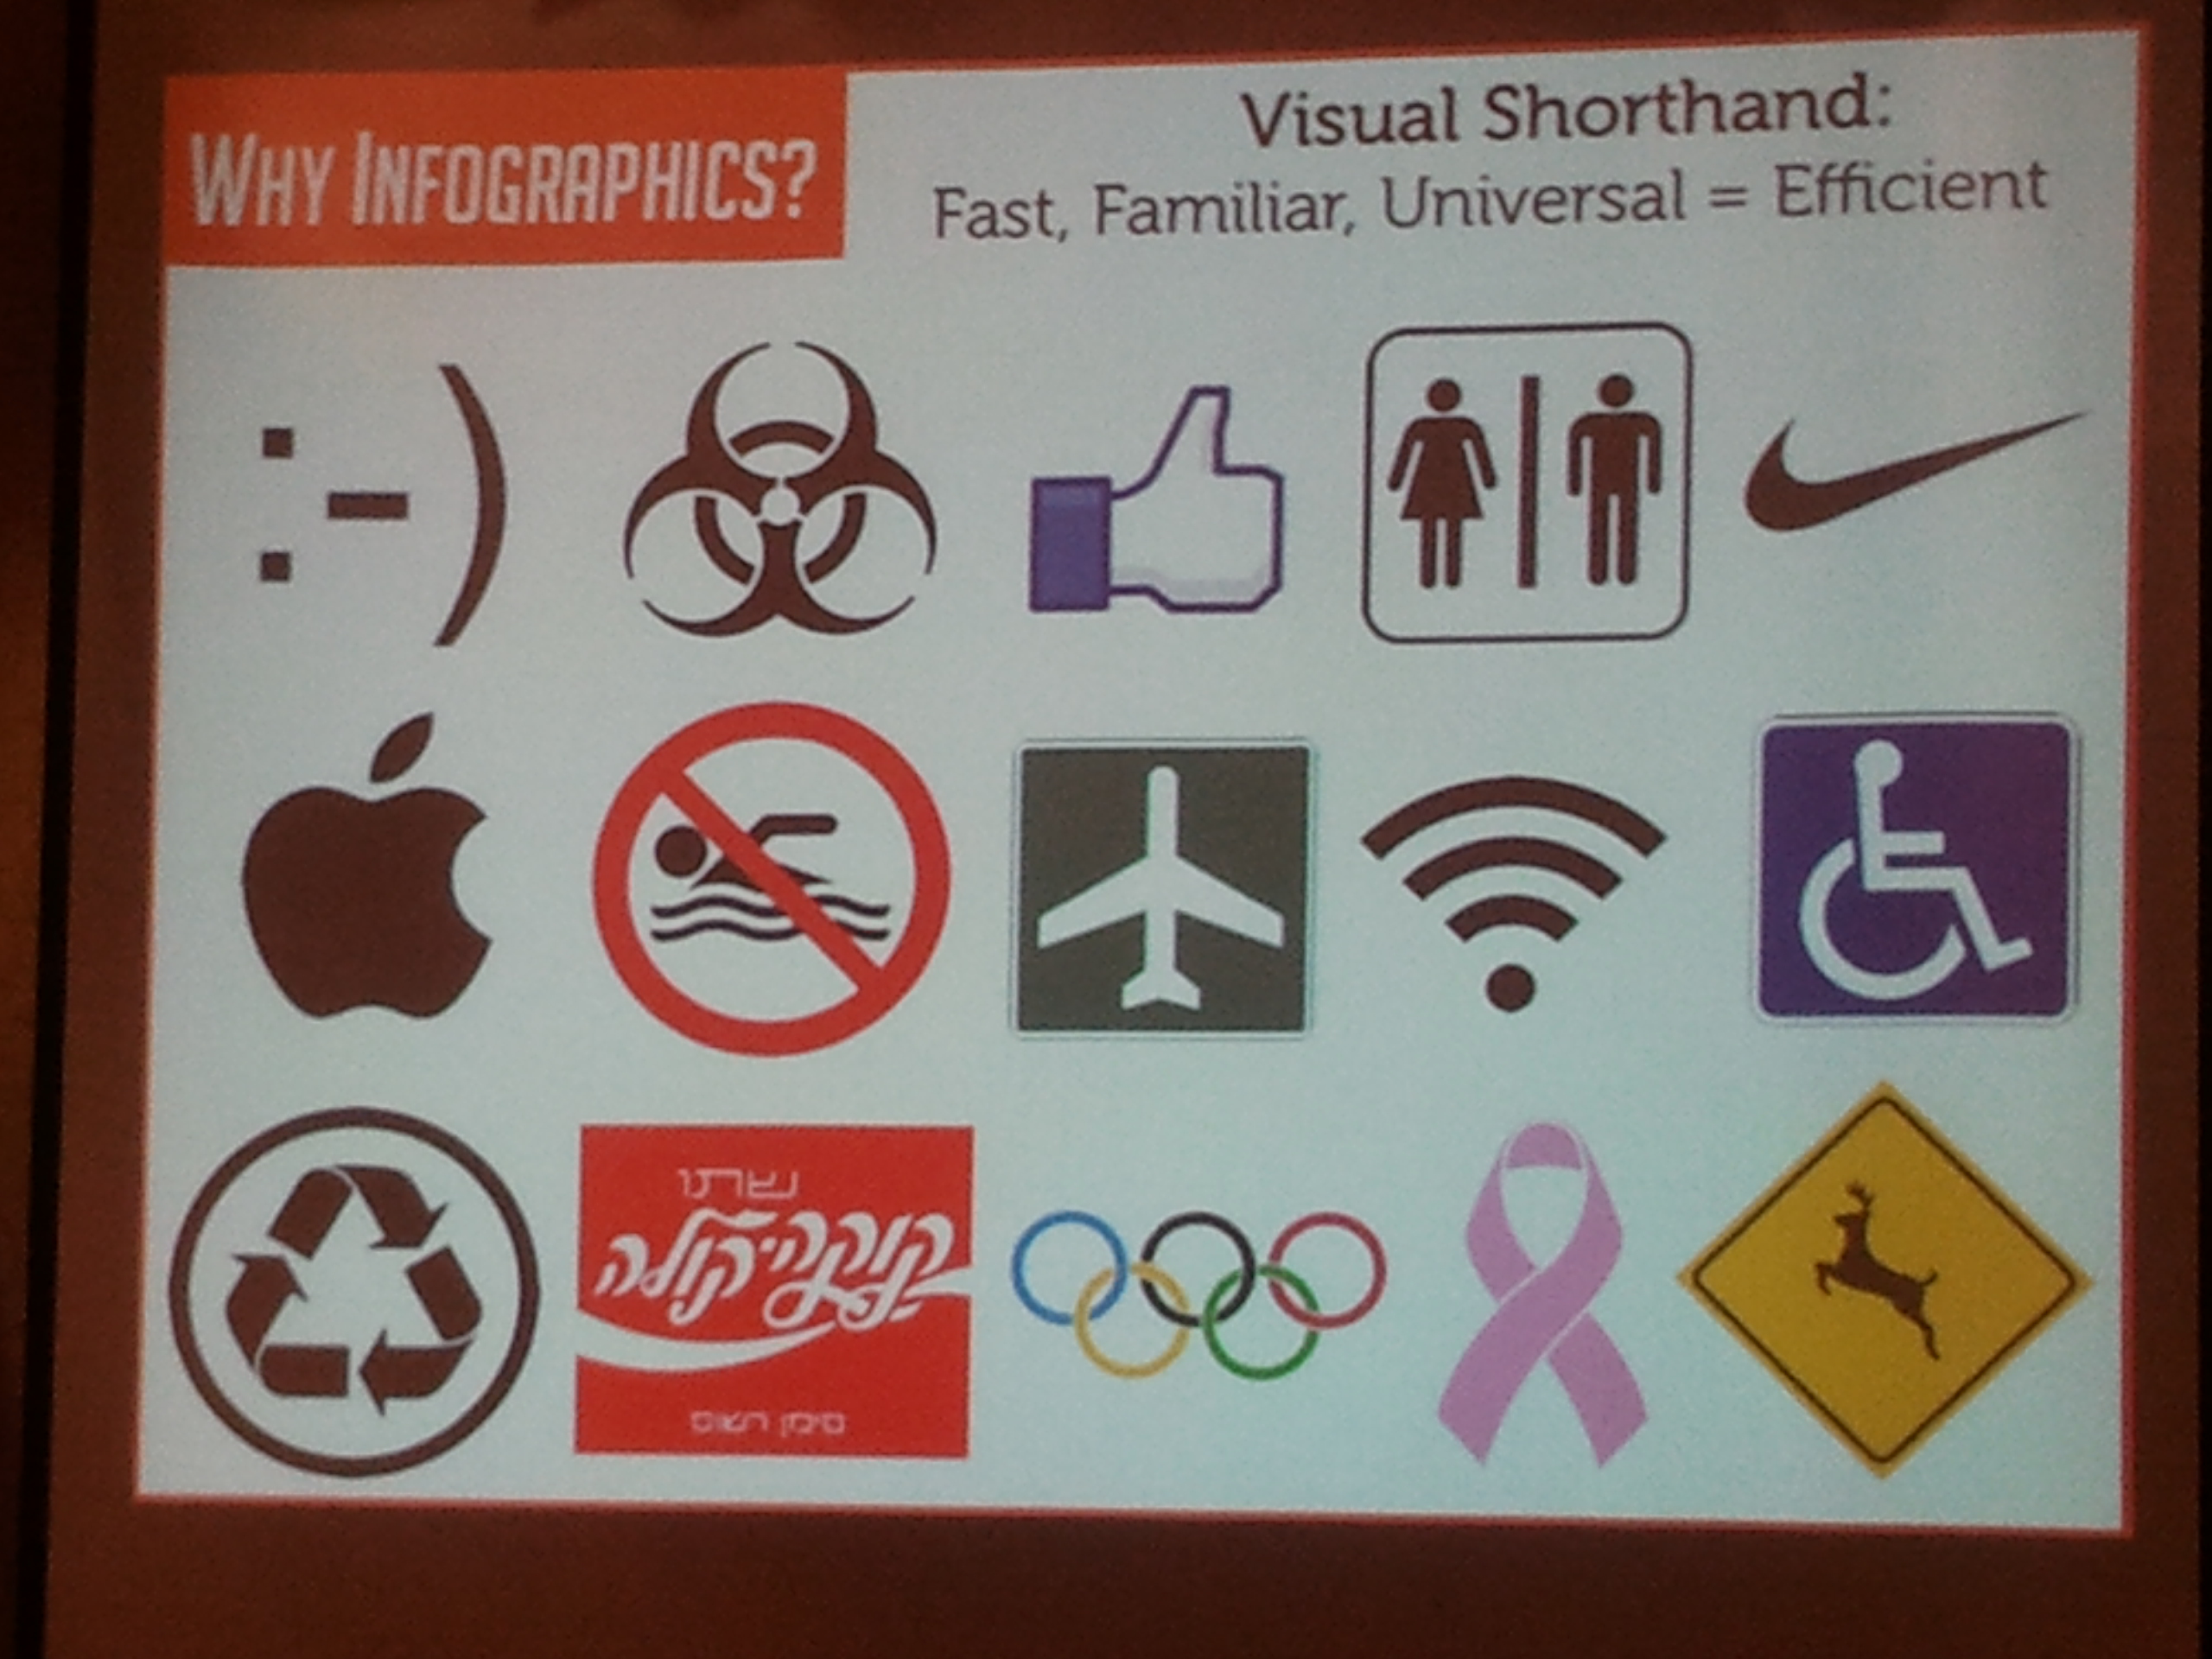
Using images that are familiar to many make it easier to understand an infographic.
Alicia Parlapiano, graphics editor, for The New York Times, said they are a way to share information and tell stories.
“Our rule of thumb is that the instant you look at an infographic it should be instantly understandable,” added Gary Seidman, president of SwitchYard Media. “It doesn’t really require any learning.”
The two were on an infographics panel at the InterAction Forum 2013 recently held in Arlington, Va.
Infographics, Seidman said, must be organized, succinct and easy to read.
Before beginning the graphic, Parlapiano recommended creating an abstract or summary to guide in the creation of the graphic. This also will help viewers to understand the purpose of the graphic.
When a person engages with an infographic, Seidman said, you need to consider what the person will take away and what you want them to remember.
Once you know the data you want to show, Parlapiano said to use the appropriate form – one that doesn’t make the display of the information too complex. The infographic also should follow the organization’s style guide by using approved fonts and layouts. She recommended creating some approved layouts for infographics so the designer doesn’t always have to begin fresh.
Other tips include:
- Don’t use excessive labeling
- Remove axes if distracting
- Add a headline and some text to describe what the viewer is supposed to be seeing
- Add a source line
- Add a credit
- Use visual shorthands with which people are familiar (examples include thumbs up and wifi symbols)
If you want to know more about infographics, check out The Wall Street Journal Guide to Information Graphics by Dona Wong. The book is all about the fundamentals so it’s a good starting point.
